Marketing Dashboard: Funnel Analysis That Pays Off (2026)
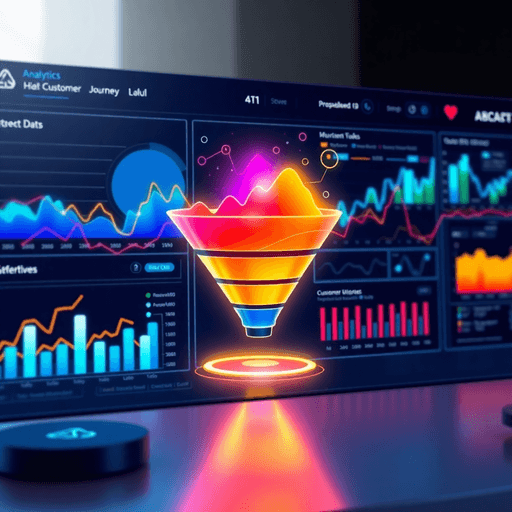
In 2026, marketing dashboards have become essential for teams looking to make decisions based on data. These platforms bring together large amounts of information and present it in a visual format, making it easier for marketers to understand their performance, spot trends, and make confident adjustments to their strategies.
With the rise of complex customer journeys and multi-channel campaigns, relying solely on raw data can be overwhelming. Often, this data is scattered across different sources that are not connected to each other. This poses a significant challenge: how can we extract clear and actionable insights without getting lost in a sea of numbers?
Funnel analysis is a key application of the data visualization best practices that drive informed decision-making.
The Importance of Funnel Analysis
Funnel analysis is crucial in tackling this challenge. It involves breaking down the customer journey into distinct stages. By doing so, funnel analytics tools provide visibility into conversion metrics at each step—whether it's ecommerce funnel analysis, brand funnel analysis, or broader marketing funnel analysis.
Understanding where potential customers drop off or hesitate allows marketers to optimize their messaging, offers, and touchpoints effectively.
How Funnel Analysis Works
A typical funnel analysis example might show how many visitors move from being aware of a product to considering it and finally making a purchase. By visualizing these stages through a marketing dashboard, we can see not only what happened but also where revenue leaks occur and where improvements can lead to growth.
The Evolution of Marketing Dashboards
Modern marketing dashboards have evolved beyond static reports. They now have the capability to transform raw data from various channels into actionable insights.
This is made possible through:
- Integration of real-time updates
- Use of predictive analytics
- Implementation of AI-driven recommendations
These advancements empower marketers to shift from reacting to situations towards proactively experimenting and continuously learning.
Benefits of Using Advanced Funnel Analytics Tools
By using advanced funnel analytics tools within sophisticated marketing dashboards, you can expect several key benefits:
- A unified view of customer interactions across different platforms
- Clear tracking of important key performance indicators (KPIs) such as conversion rates and drop-offs
- Immediate identification of bottlenecks in the conversion funnel
- Data-backed suggestions for optimizing campaigns and improving return on investment (ROI)
With these advantages at your disposal, you'll not only gain clarity but also the ability to take decisive actions based on customer insights that directly impact your business outcomes.
Understanding Funnel Analysis in Marketing Dashboards
Funnel analysis involves looking at the specific steps users take to reach a goal, like buying something or signing up for a newsletter. In marketing, this analysis helps us understand the customer journey funnel, showing how potential customers move from being aware of our brand to actually making a purchase. By doing this, we can figure out where people are dropping off and what we can do to improve those conversion rates.
Purpose of Funnel Analysis in Marketing
Funnel analysis serves several important purposes in marketing:
- Track user behavior: Understand how users interact with your brand across multiple touchpoints.
- Measure effectiveness: Assess the performance of marketing campaigns by monitoring movement through funnel stages.
- Optimize conversions: Pinpoint bottlenecks and friction points that reduce conversion rates.
- Inform decision-making: Use data-driven insights to refine strategies and allocate marketing resources efficiently.
Key Stages of a Typical Marketing Funnel
Most marketing funnels have a few main stages, each with its own key performance indicators (KPIs). By tracking these KPIs at each stage, we can better understand how many users are progressing through the funnel and how many are dropping off.
Awareness
KPI examples: Impressions, reach, unique visitors
Interest
KPI examples: Click-through rates (CTR), time on page, engagement metrics
Consideration
KPI examples: Lead form submissions, product page views, demo requests
Conversion
KPI examples: Completed purchases, sign-ups, trial activations
Loyalty and Retention
KPI examples: Repeat purchases, subscription renewals, customer lifetime value (CLV)
How Funnel Analytics Identify Drop-Offs and Optimize Conversion Rates
Funnel analytics platforms like Mixpanel funnel analysis provide detailed visualization tools to see exactly where users abandon the process. By analyzing these drop-offs, you can:
- Discover unexpected friction points.
- Prioritize areas for testing improvements.
- Measure the impact of changes on overall funnel health.
For example, if a large percentage of users exit at the payment stage, it might indicate usability issues or lack of trust signals that need addressing.
Differentiating Between Various Types of Funnels
Different funnels serve distinct purposes depending on business models and objectives:
- Sales Funnel Analysis: Focuses on lead qualification and closing deals. Tracks stages like lead generation, opportunity creation, proposal sent, and deal won.
- Marketing Funnel Analysis: Concentrates on awareness and engagement before leads enter sales. Includes metrics like ad impressions, website visits, and content downloads.
- Ecommerce Funnel Analysis: Emphasizes online shopping behavior—product views, cart additions, checkout initiations, and completed transactions.
Understanding the specific funnel type helps tailor your user funnel analysis approach and select appropriate tools for deeper insights.
The practice of analyzing funnels is not limited to identifying what happened but extends into understanding why it happened and what should happen next. This mindset shapes how modern marketing dashboards present funnel data—not just as static reports but as dynamic guides for continuous optimization.
Components of an Effective Marketing Dashboard for Funnel Analysis
Creating a marketing dashboard that delivers actionable funnel data analysis requires attention to several critical components. These elements ensure that your customer funnel analysis not only displays accurate data but also drives decisions that improve conversion rates and revenue outcomes.
Real-Time Data Integration and Clear KPI Tracking
- Real-time data feeds allow marketers to react promptly to shifts in customer behavior. Whether you use Datadog funnel analysis or another tool, the ability to see up-to-the-minute metrics prevents lagging insights.
- Tracking clear and relevant KPIs is fundamental. Common KPIs include conversion rates between funnel stages, average time spent at each stage, drop-off percentages, and revenue impact per segment.
- Tools like GA4 funnel analysis provide built-in KPI tracking aligned with web traffic and user engagement, helping you monitor digital touchpoints efficiently.
- Avoid clutter by focusing on a concise set of KPIs tied directly to your marketing objectives. This clarity guides teams toward meaningful improvements rather than overwhelming them with excessive metrics.
Unified Data Pipelines to Reduce Fragmentation
- Marketing efforts span multiple channels—social media, email campaigns, paid ads, websites—and consolidating these data streams is essential for accurate funnel visualization.
- A unified data pipeline integrates all source systems into a single repository where funnel analytics software can draw consistent data sets.
- Fragmented data leads to discrepancies and blind spots in understanding customer journeys. Using platforms that support cross-channel integration enhances reliability.
- For instance, combining CRM data with website analytics within tools like Tableau enables deeper insights into how leads progress through the funnel beyond surface-level interactions.
Strong Data Governance for Consistency and Trustworthiness
- Having robust governance policies ensures measurement consistency across teams and timeframes. This includes standardized definitions of funnel stages, uniform event tracking protocols, and controlled access to sensitive datasets.
- Good governance prevents common pitfalls such as duplicated records, inconsistent attribution models, or unverified conversions that skew funnel analysis results.
- Trustworthy data encourages confidence in decision-making. When marketers rely on clean and governed datasets, experimentation becomes less risky and more strategic.
- Documenting governance frameworks is vital when scaling dashboards or onboarding new team members who interact with funnel reports regularly.
Visualization Best Practices Highlighting Conversion Rates and Revenue Leaks
Strong visual design makes complex funnel metrics understandable at a glance:
- Use funnel-shaped charts or stepwise bar graphs that clearly depict user flow from one stage to the next.
- Incorporate color coding—green for healthy conversion rates, red for significant drop-offs—to quickly signal areas needing attention.
- Interactive dashboards enable users to drill down into specific segments or time periods for granular inspection.
- Combine quantitative visuals with contextual annotations explaining anomalies or recent campaign impacts.
- Examples like funnel analysis Excel templates emphasize simplicity but can fall short at scale; dedicated tools like market funnel analysis platforms offer richer interactivity suited for enterprise needs.
Presenting both conversion percentages and absolute values alongside estimated revenue loss at each stage provides a comprehensive view of performance gaps and financial implications.
These marketing dashboard components create a solid foundation for effective funnel analysis. They transform raw numbers into clear insights about where prospects slip away and what actions yield the highest returns.
Advanced Analytics Techniques Enhancing Funnel Analysis in 2026
Advanced analytics is reshaping how you approach funnel analysis in marketing dashboards. Moving beyond simple descriptive metrics, these techniques empower you to forecast trends, diagnose issues, and optimize customer journeys proactively.
Leveraging AI and Machine Learning for Predictive Insights
- Predictive Analytics: Unlike traditional funnel analysis that reports past performance, predictive analytics uses historical data patterns to anticipate future outcomes. This means your Marketing Dashboard can forecast conversion probabilities at each stage of the funnel, helping allocate resources more efficiently.
- AI in Marketing Dashboards: Artificial intelligence algorithms analyze vast datasets from multiple channels—websites, apps, CRM systems—to identify subtle correlations and anomalies that might escape manual review. For instance, AI-powered platforms can detect early signs of customer drop-off or predict high-value leads based on behavior patterns.
- Full Funnel Analytics: Integrating data across all stages—from awareness through purchase and retention—gives a holistic view. AI enhances this by linking actions across touchpoints and assigning impact scores, enabling you to pinpoint bottlenecks precisely.
Intelligent Systems Driving Continuous Learning and Adaptation
- Automated Anomaly Detection: Intelligent dashboards continuously scan funnel metrics for unusual changes. When a sudden dip in conversion appears in your Hotjar conversion funnel or app funnel analysis, the system alerts you immediately, speeding up troubleshooting.
- Dynamic Segmentation and Personalization: Machine learning segments users dynamically based on engagement behaviors without manual tagging. This allows for targeted interventions on specific groups where drop-offs occur most frequently.
- Adaptive Recommendations: Some platforms extend beyond visualization by suggesting next best actions—whether that’s tweaking ad spend or testing new landing page variants. These recommendations evolve as the system learns from ongoing campaign results.
Examples of Advanced Funnel Analysis Applications
- Funnel Analysis in Google Analytics now integrates machine learning models to predict user churn risk or lifetime value, providing marketers with actionable insights directly within familiar interfaces.
- Tools like Hotjar Funnel Analysis combine session recordings with conversion data to reveal user experience pain points causing revenue leaks.
- App Funnel Analysis leverages device-level data and behavior tracking enhanced by AI to optimize onboarding flows and reduce app abandonment rates.
This evolution from static reporting to intelligent predictive systems transforms your marketing dashboard into a strategic ally. You gain not only clarity on what happened but also foresight into what will happen—and guidance on how to act next—making your funnel analysis truly pay off in 2026.
Popular Funnel Analytics Tools and Platforms in 2026
Marketing teams in 2026 rely on a variety of funnel analysis tools tailored to different needs—ranging from product management to website optimization and sales performance tracking. Choosing the right platform depends on your specific goals, data sources, and the complexity of the customer journey you want to visualize.
Amplitude Funnel Analysis
Amplitude remains a top choice for product funnel analysis. It excels at capturing user behavior within digital products, making it ideal for SaaS companies, mobile apps, and platforms focused on user engagement and retention. Key features include:
- Behavioral cohort analysis that segments users based on actions taken within the product.
- Customizable funnels that track multi-step journeys, helping pinpoint where users drop off during onboarding or feature use.
- Advanced pathfinding that uncovers unexpected user flows beyond predefined funnels.
- Real-time data updates for agile decision-making.
Amplitude’s strength lies in its ability to link product usage directly to business outcomes like subscription upgrades or feature adoption. This makes it indispensable for marketing funnel analytics where product engagement drives revenue.
Google Analytics 4 Funnel Analysis
Google Analytics 4 (GA4) continues to dominate website funnel analysis by providing deep insights into visitor behavior across websites and digital campaigns. Its advantages include:
- Event-based tracking that moves beyond session metrics to capture specific interactions.
- Built-in funnel exploration tools that show conversion rates across stages such as landing page visits, add-to-cart actions, and checkout completions.
- Seamless integration with Google Ads and other Google marketing tools for end-to-end campaign measurement.
- AI-powered insights surface anomalies and suggest optimization opportunities automatically.
GA4 suits marketers focusing on eCommerce funnels or lead generation sites. Its comprehensive web tracking data helps refine acquisition channels and optimize conversion paths from first click through purchase.
Mixpanel
Mixpanel offers strong capabilities for both marketing funnel analytics and product funnel analysis. It provides granular event tracking combined with flexible reporting options:
- Funnels can be built with multiple conversion criteria that adapt as user behavior evolves.
- User retention reports help evaluate the long-term impact of marketing campaigns.
- Predictive analytics identify users likely to churn or convert soon.
- Integration with customer messaging platforms enables targeted interventions based on funnel stage.
Teams seeking actionable insights tied to individual user journeys often prefer Mixpanel’s balance of ease-of-use with powerful analytics functions.
Adobe Analytics
Adobe Analytics supports enterprises requiring robust, customizable sales funnel analytics across multiple channels:
- Multi-channel attribution models assign credit accurately throughout complex buyer journeys.
- AI-driven anomaly detection highlights sudden drops or spikes in conversion rates.
- Flexible dashboarding tools allow tailored views for various stakeholders—from marketers to executives.
- Strong data governance features ensure compliance and consistency across global operations.
Brands with large-scale digital ecosystems benefit from Adobe’s depth in handling diverse data sources while maintaining precise measurement standards.
Heap Analytics
Heap automates much of the event-tracking process, making it popular for teams wanting quick access to funnel insights without heavy setup:
- Automatic capture of all user interactions enables retroactive funnel creation without prior planning.
- Visual funnels highlight drop-off points dynamically as new events are tracked.
- Supports both website and product funnel analysis through unified data collection.
Heap is well suited for startups or businesses experimenting with new funnels who need flexibility without sacrificing detail.
Selecting between these funnel analysis tools requires weighing factors like platform focus (product vs. website), scalability, integration possibilities, and analytical sophistication. You might find yourself combining several platforms—for example, using Amplitude for detailed product engagement funnels alongside GA4 for broader web traffic analysis—to get comprehensive coverage of your marketing ecosystem. Matching tool strengths with your unique customer journey challenges unlocks more precise insights that truly pay off in campaign optimization.
Case Studies Demonstrating Effective Funnel Analysis Implementation
Marketing teams that embrace funnel analysis dashboards experience tangible gains in understanding and optimizing customer journeys. These real-world examples highlight how different industries and platforms leverage funnel insights to drive growth.
1. SaaS Company Using Funnel Analysis with Amplitude
A leading SaaS provider implemented funnel analysis with Amplitude to track user onboarding and feature adoption. Key outcomes included:
- Identification of a critical drop-off after account creation, traced to unclear UI messaging.
- Targeted A/B tests on signup flows increased conversion rates by 18%.
- Data science teams used Amplitude's behavioral cohorting to segment users for personalized re-engagement campaigns.
This case demonstrates the power of funnel analysis data science techniques combined with product analytics for continuous improvement.
2. E-Commerce Brand Leveraging Google Funnel Analysis
An e-commerce retailer utilized Google funnel analysis integrated with Google Analytics and Firebase to optimize their mobile app and web funnels:
- The acquisition funnel analysis showed high traffic but low checkout completion on mobile devices.
- Firebase funnel analysis revealed app crashes correlated with drop-offs at payment steps.
- Addressing app stability improved conversion rates by 12% in three months.
This example illustrates how combining mobile app funnel analysis with platform-specific tools like Firebase enables pinpointing technical friction points.
3. Mobile Gaming Company Applying Funnel Analysis in Python
A mobile gaming startup employed custom funnel analysis in Python to track player progression through tutorial levels:
- Automated scripts processed large event datasets from game telemetry.
- Visualization libraries helped highlight where users abandoned early stages.
- Insights guided game design tweaks, resulting in a 25% boost in retention beyond day 7.
Using open-source data science tools for funnel tracking allows flexibility tailored to specific product needs.
4. B2B Marketing Agency Using Acquisition Funnel Analysis
A B2B marketing agency adopted acquisition funnel analysis case study approaches to optimize lead generation campaigns across channels:
- Unified dashboards aggregated data from CRM, email, and paid ads.
- Analysis revealed underperforming landing pages causing lead leakage.
- Iterative improvements aligned content and CTAs, improving qualified leads by 30%.
This case reflects the importance of unified pipelines and consistent measurement across fragmented marketing sources.
These examples underscore that effective funnel dashboards are not just about visualization but about integrating data-driven experimentation into marketing workflows. Whether using tools like Amplitude or Google Analytics, or leveraging programming languages such as R or Python for advanced analytics, organizations gain clarity on customer behavior and actionable paths toward higher conversions.
Best Practices for Building a High-Impact Funnel Analysis Dashboard in 2026
Creating a marketing dashboard that delivers clear insights and drives action requires more than just assembling data. You need to design it with precision, focusing on the core principles that align your funnel analysis with business objectives and sales goals. The following best practices guide you through building a high-impact marketing dashboard, whether you're working on growth funnel analysis, lead funnel analysis, onboarding funnel analysis, or specific cases like patient funnel analysis or purchase funnel analysis.
1. Define Consistent and Relevant KPIs
Key Performance Indicators (KPIs) are metrics that help you measure the success of your marketing efforts. To ensure your KPIs are effective, follow these guidelines:
Align KPIs with Business Objectives
Start by identifying key performance indicators that directly reflect your company’s strategic goals. If your priority is customer acquisition, focus on metrics like lead conversion rates or onboarding completion percentages.
Tailor KPIs by Funnel Type
Different funnels require different KPIs:
- Growth funnel analysis may emphasize visitor-to-lead conversion.
- Lead funnel analysis should monitor qualified leads and lead nurturing stages.
- Onboarding funnel analysis tracks activation milestones.
- Patient funnel analysis focuses on appointment completion and follow-up adherence.
- Purchase funnel analysis measures cart abandonment and purchase completion rates.
Maintain KPI Consistency Over Time
Use standardized definitions to ensure comparability across reporting periods. This consistency helps spot trends and anomalies accurately.
2. Prioritize Data Quality and Governance
Data quality is crucial for making informed decisions. Here are some best practices to ensure your data is reliable:
- Establish strong data validation processes to avoid misleading conclusions caused by inaccurate or incomplete records.
- Implement unified data pipelines to consolidate information from multiple sources, reducing fragmentation common in complex marketing ecosystems.
- Apply clear ownership and accountability for data inputs to maintain trustworthiness.
3. Employ Clear Visualization Techniques
Visualizations make it easier to understand complex data. Use these techniques to create effective visual representations of your funnel analysis:
- Use simple, intuitive charts that highlight critical drop-off points in the funnel without overwhelming users with excessive details.
- Color-code conversion rates and revenue leaks for quick identification of trouble spots.
- Interactive elements allow exploration of underlying data for deeper understanding during meetings or strategy sessions.
4. Incorporate Automation with Python Funnel Analysis Scripts
Automation can save time and improve efficiency in your funnel analysis process. Consider implementing these strategies:
- Automate routine data extraction and transformation tasks using Python scripts tailored for funnel analytics.
- Custom coding enables flexibility beyond out-of-the-box tools like Looker funnel analysis dashboards, adapting to unique business rules or complex user journeys.
- Automation frees up analysts’ time to focus on interpreting results rather than manual data wrangling.
5. Foster Collaboration Between Marketing and Sales Teams
Collaboration between marketing and sales teams is essential for achieving shared revenue goals. Here are some ways to promote collaboration:
- Build dashboards that integrate sales pipeline metrics alongside marketing funnels to create a unified view of the customer journey.
- Encourage joint review sessions where both teams analyze performance metrics together, aligning efforts toward shared revenue goals.
6. Update Dashboards Frequently but Thoughtfully
Regularly updating your dashboards ensures that you have access to the most current information. However, be mindful of how often you update them:
- Real-time or near-real-time updates provide timely insights but require stable data flows and governance frameworks.
- Avoid cluttering dashboards with too many metrics updated unnecessarily; focus on actionable KPIs that support decision-making cycles.
7. Customize Dashboards for Different Stakeholders
Different stakeholders have different needs when it comes to accessing information. Tailor your dashboards accordingly:
- Executives prefer high-level summaries showcasing impact on revenue and growth trajectories.
- Marketing managers need detailed breakdowns of channel performance within the lead or onboarding funnels.
- Data analysts benefit from drill-down capabilities into raw data for diagnostic purposes.
Applying these marketing dashboard best practices ensures your funnel analysis not only reports what happened but actively supports strategic decisions that accelerate growth. Whether you leverage Looker funnel analysis tools, custom Python scripts for automation, or specialized dashboards for patient journey tracking, aligning your KPIs tightly with business outcomes remains the cornerstone of a high-impact marketing dashboard in 2026.
Future Trends Shaping Marketing Dashboards and Funnel Analytics
The future of marketing dashboards is moving toward fully integrated, AI-powered systems that continuously learn and adapt. These intelligent platforms go beyond static reporting by dynamically adjusting to new data patterns, customer behaviors, and campaign results without manual intervention. This shift will redefine how teams approach digital marketing funnel analytics, making insights more predictive and actionable.
Key Trends Reshaping Funnel Analytics
AI-Driven Continuous Learning
Advanced machine learning models embedded within dashboards analyze vast datasets from multiple sources — including ecommerce funnel analytics, mobile app funnel analytics, and website conversion funnel analysis — to identify emerging trends and anomalies in real time. The AI's ability to self-tune enhances accuracy in forecasting conversions and drop-offs at every stage of the customer journey.
Seamless Multi-Channel Integration
Marketing funnels no longer exist in isolation. Dashboards increasingly consolidate data from social media, email campaigns, paid search, organic traffic, and offline channels. This integration enables a holistic view of upper funnel performance and downstream conversions, surpassing traditional siloed approaches such as relying solely on sales funnel analysis Excel sheets.
Personalized Funnel Insights for Specific Industries
Industry-tailored analytics are gaining traction, with platforms adapting their focus to match sector-specific needs:
- Ecommerce funnel analytics platforms emphasize cart abandonment rates, checkout flows, and product page engagement metrics.
- Mobile app funnel analytics focus on user onboarding sequences, in-app purchase behavior, and retention cohorts.
- Website-centric tools highlight granular details like bounce rates within the website conversion funnel analytics framework or heatmap overlays pinpointing friction points.
Predictive Upper Funnel Analysis
Early-stage funnel metrics traditionally received less attention due to measurement complexity. New AI-powered dashboards excel at interpreting behaviors at the awareness and consideration stages — tracking impression quality, ad interaction depth, and content engagement — to forecast downstream impact on conversions more reliably.
Automated Recommendations and Scenario Modeling
Beyond identifying issues, future dashboards suggest targeted actions such as adjusting ad spend allocation or modifying landing pages based on simulated outcomes. Marketers can run "what-if" scenarios directly within the platform to understand potential ROI before committing resources.
Enhanced Visualization Techniques
Interactive visualizations are evolving to present complex funnel dynamics intuitively. Features like drill-down capabilities across different funnel layers help reveal subtle revenue leaks or conversion bottlenecks that static charts might miss.
Privacy-Compliant Data Handling with Governance Automation
As data privacy regulations grow stricter globally, future marketing dashboards embed automated governance frameworks ensuring compliant data collection and processing across all touchpoints without compromising analytical depth.
These innovations collectively elevate marketing dashboards from tools that simply show where customers drop off to strategic engines powering continuous optimization across diverse marketing ecosystems. With increasing reliance on AI-driven intelligence fused with rich multi-channel data sets, marketers gain unprecedented clarity into the entire customer journey — from upper funnel awareness through final sales conversion — in formats tailored for agile decision-making.
This transformation is especially critical as marketing environments grow more complex with the rise of new channels like voice search, augmented reality ads, and connected devices — all demanding sophisticated yet accessible analytics solutions embedded within next-generation dashboard platforms.
Conclusion
A well-designed marketing dashboard is more than a static report—it's a dynamic tool that drives learning, innovation, and measurable results. This marketing dashboard summary highlights the critical need for intelligent platforms that integrate clean data, advanced analytics, and AI capabilities to unlock true marketing intelligence.
You should focus on adopting solutions that:
- Foster continuous learning: Platforms that evolve with your campaigns and adapt based on new data insights enable smarter decision-making.
- Encourage experimentation: Insights must translate into actionable next steps, empowering teams to test hypotheses confidently.
- Align with business goals: Consistent KPIs linked directly to sales objectives ensure marketing efforts deliver tangible impact.
- Unify fragmented data sources: Seamless integration across channels eliminates blind spots and creates a single source of truth.
- Balance human insight with machine intelligence: The best dashboards combine expert interpretation with automated predictions to guide strategy.
Marketing teams embracing these principles will transform raw numbers into powerful narratives about customer behavior and business growth. The future belongs to those who leverage intelligent marketing dashboards as strategic platforms—not just for reporting but for proactive innovation.
Make your next marketing dashboard investment count by choosing tools designed to pay off through clarity, agility, and continuous improvement. This approach fuels campaigns that perform better today and position you ahead in the rapidly evolving landscape of 2026 and beyond.
FAQs (Frequently Asked Questions)
What is the importance of marketing dashboards in 2026 for data-driven decision making?
Marketing dashboards in 2026 are crucial as they integrate data from multiple sources to provide real-time insights, enabling marketers to make informed, data-driven decisions that optimize campaigns and improve conversion rates.
How does funnel analysis help visualize customer journeys and improve conversion metrics?
Funnel analysis visualizes each stage of the customer journey, identifying where potential customers drop off. By analyzing these stages and associated KPIs, marketers can optimize strategies to reduce leaks in the funnel and enhance overall conversion rates.
What are the essential components of an effective marketing dashboard for funnel analysis?
An effective marketing dashboard includes real-time data integration, unified data pipelines to minimize fragmentation, strong data governance for consistent measurement, and clear visualizations highlighting key metrics like conversion rates and revenue leaks.
How are advanced analytics techniques like AI enhancing funnel analysis in 2026?
Advanced analytics techniques, including AI and machine learning, enable predictive insights beyond descriptive metrics. These intelligent systems support continuous learning and adaptation of marketing strategies, leading to more accurate forecasting and improved funnel performance.
Which popular tools are recommended for funnel analytics in 2026 and what are their strengths?
Leading tools include Amplitude for product funnel analysis due to its detailed user behavior tracking, Google Analytics 4 for website funnel visualization with robust traffic analysis features, Hotjar for conversion funnel heatmaps, and Datadog for unified monitoring across channels.
What best practices should marketers follow when building a high-impact funnel analysis dashboard in 2026?
Marketers should establish consistent KPIs aligned with business objectives, ensure real-time unified data integration, apply strong data governance, utilize intuitive visualizations to highlight critical metrics, and leverage AI-powered insights to continuously optimize the marketing funnel.
Comments
Post a Comment